
Every candle records four prices in one period: Open, High, Low, Close.
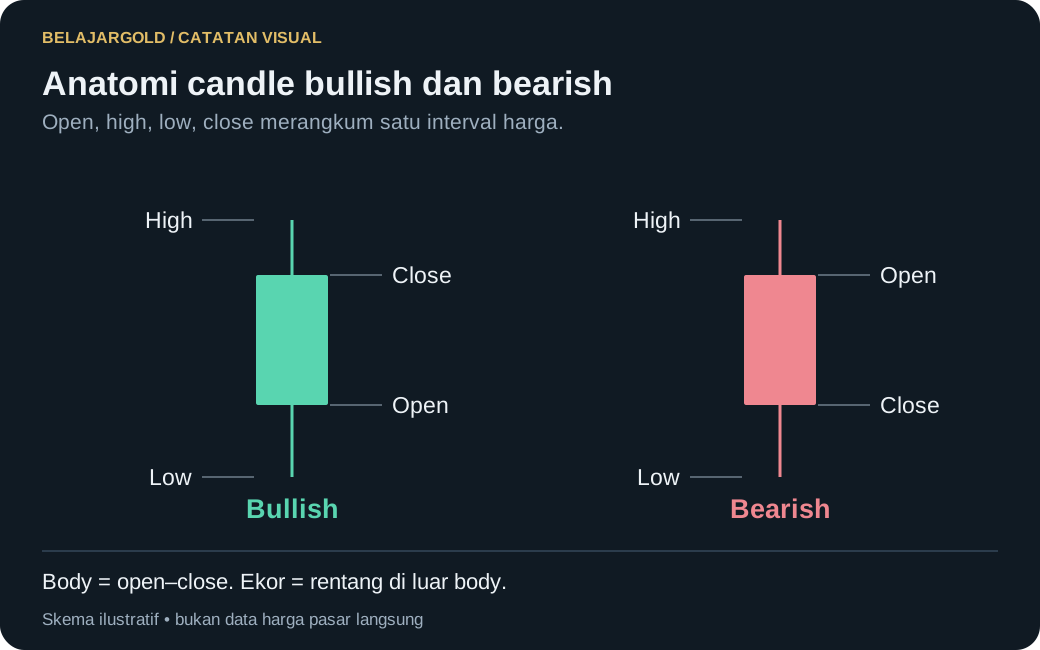
- Body — the distance between open and close. A long body = a decisive move in one direction.
- Wick / shadow — the distance from the body to the high/low. A long wick = price went there and was then rejected.
- Color — usually green/white when close > open (bullish), red/black when close < open (bearish).
How to read it
Ask three things: (1) who closed in the winning position — buyers or sellers? (2) how convinced were they, judging by the body length? (3) was there rejection, judging by the wicks?
Key points
- Body = conviction. Wick = rejection. Color = the winner of that period.
- A single candle rarely means much without the candles around it.
Save your learning progress
Sign up free to mark lessons as completed and unlock all member lessons.
Sign Up Free
Risk disclaimer: all content on this site is provided for educational purposes and is not financial advice, signals, an invitation to trade, or a promise of profit. Trading carries a high risk and may result in the loss of part or all of your capital. Check the legality of service providers in your jurisdiction.